History across every launch
Ambih Monitor records CPU, memory, disk and network for every run of your project. Compare launches side-by-side — the trend, not just the last 60 seconds.
Features
Live resource monitoring, per-project history, statistical regression detection and a floating mini-monitor — for your dev servers and desktop apps alike. Here is the full picture, with screenshots.
Ambih Monitor records CPU, memory, disk and network for every run of your project. Compare launches side-by-side — the trend, not just the last 60 seconds.
When memory creeps or CPU jumps between runs, Ambih Monitor flags it. Find the leak in your dev environment — not from a 2 a.m. alert.
AI writes code that works; rarely code that runs lean. Ambih Monitor catches the memory bloat and CPU debt your assistant didn’t think to optimize.
Know exactly how much CPU and RAM your app really needs before you provision a server. Stop overpaying for headroom you’ll never use.
Label a run with what you’re building — auth, checkout, import. See which features actually drive your app’s footprint.
Cap any project at, say, 25 % CPU and 1 GB RAM. Safe sandboxing for runaway dev servers and overeager AI-generated code that loves to allocate.
Inside the app
See CPU, RAM, network and disk update in real time while your project runs. When something deviates from the project’s typical behaviour, Pro flags it as Spike / Drift / Critical and keeps a per-session list of every event with σ scores and the values that triggered it.

Pick a project and see how today’s run compares to the median of recent runs — by CPU, RAM, network and disk. A weighted, sign-aware score classifies the latest as Stable, Watch or Regression, with a confidence indicator based on how much history is in the corpus.

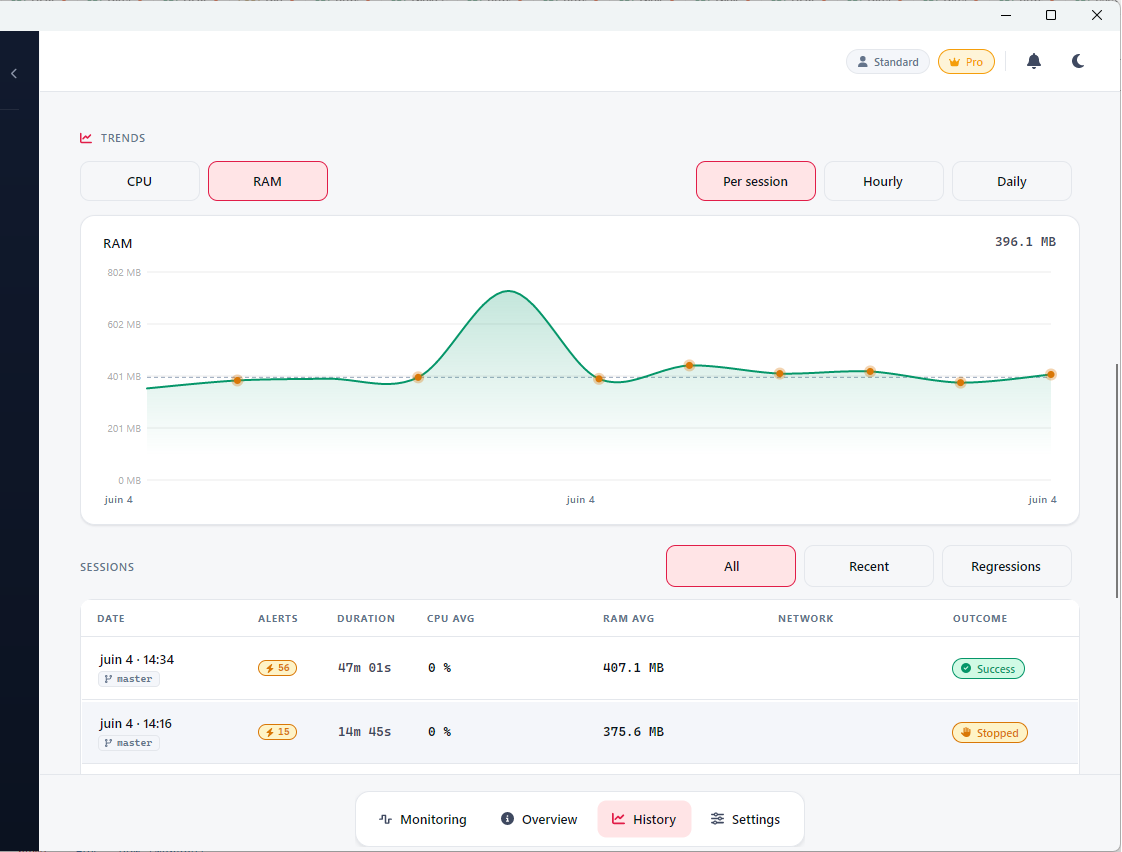
Every launch is kept and charted. Track CPU, RAM and network trend lines per session, hourly or daily, with a dashed median baseline and one-click access to any past run from the sessions table.
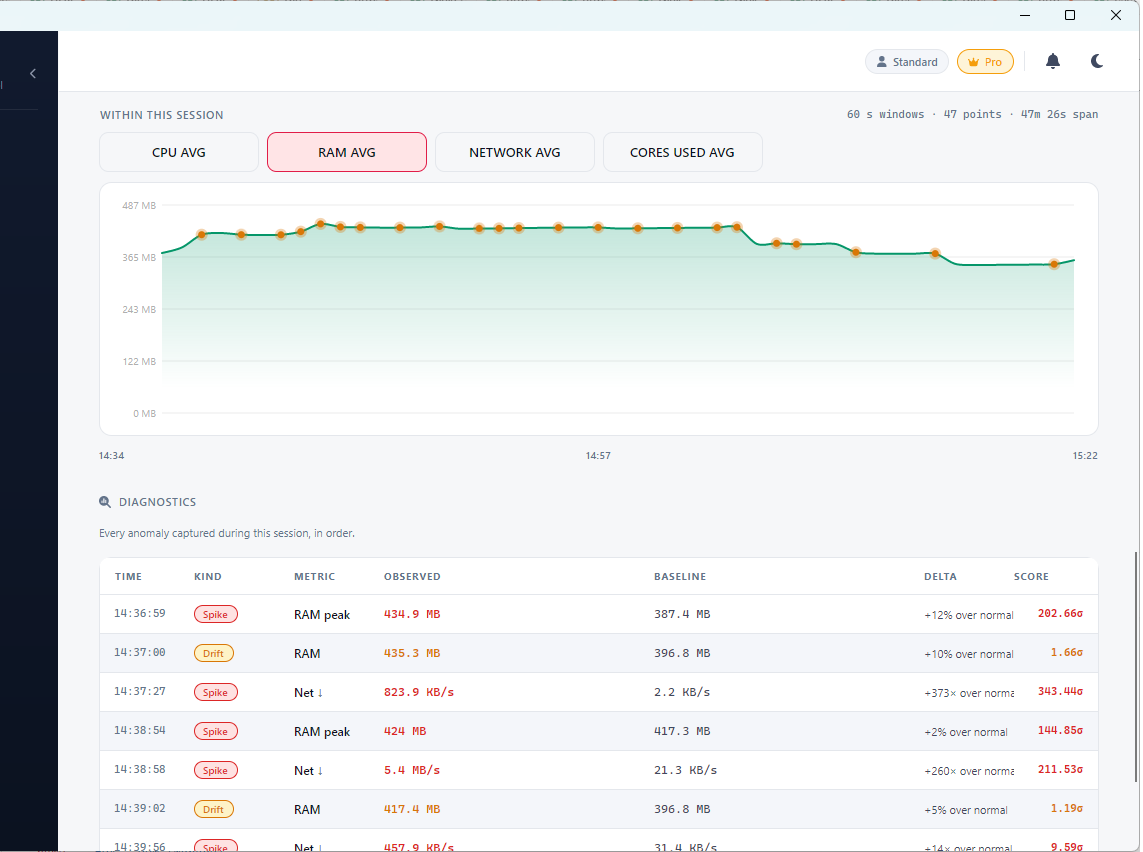
Click any past session for a memory-growth banner, three pill tabs (Session avg / Current / Compared to last 9), per-resource spike intervals, and an intra-session trend chart for CPU / RAM / Network / Cores used. The comparison view replays the verdict as it would have looked when the session ended.

Each session keeps a full diagnostics log: every spike and drift event with the metric, the observed value, the baseline it broke from, the delta and a σ score — so you see exactly when and how a run went off the rails.
Every project gets an at-a-glance card: detected stack with framework + dep count, Git branch with dirty/clean state, nested-project list inside monorepos, and one-click launchers for VS Code, your terminal and the file manager.

While you code in another window, the floating widget shows CPU, RAM, network up/down for the current project. Compact, retractable, and you can pop out the output terminal alongside it when you want it.

Pro features
Free gives you live monitoring and a 5-session history per project. Pro adds the analytics layer: anomaly detection, regression scoring, baseline health, and a session deep-dive that compares any run to the nine before it.
Scaled-MAD spike scoring and a one-sided CUSUM drift detector flag the moment your app starts behaving differently. Severity-graded — only Warning and Critical ping the bell.
Robust z-score against the prior nine comparable sessions, with a Bonferroni guard so noise can’t flip the verdict. Stable, Watch or Regression — labelled, never hidden.
Per-project median + scaled MAD baselines for CPU, RAM, network and disk. A weighted multi-factor score tells you whether this launch is normal evolution or a real change.
For any past run: memory growth banner, per-resource spike intervals, an ordered anomaly list with σ scores, and a "Compared to last 9" verdict that replays as if you opened it that day.
Unlimited session history (Free keeps the most recent 5) with CPU, RAM and network trend lines, dashed median baselines, and chart-annotation dots for sessions with anomalies.
A launch segmenter separates startup transients from steady state, so a slow startup doesn’t contaminate your steady-state baseline — and a real startup regression shows up where you can see it.
Free for individual developers. Windows, ~30 MB, no account required to start.
Download for Windows